limix.plot.normal
- limix.plot.normal(x, bins=20, nstd=2, ax=None)[source]
Plot a fit of a normal distribution to the data in x.
- Parameters
Example
(Source code, png)
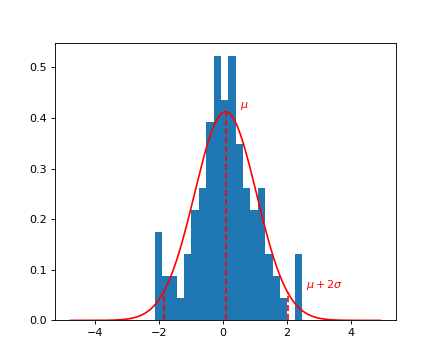
Plot a fit of a normal distribution to the data in x.
Example
(Source code, png)