limix.plot.manhattan
- limix.plot.manhattan(data, colora='#5689AC', colorb='#21334F', pts_kws=None, ax=None)[source]
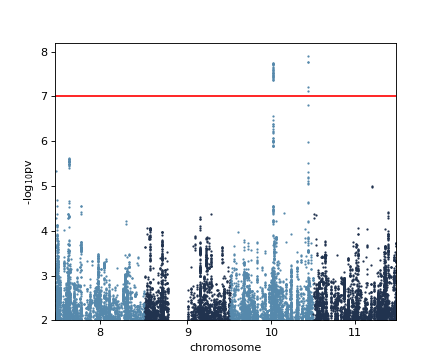
Produce a manhattan plot.
- Parameters
data (DataFrame, dict) – DataFrame containing the chromosome, base-pair positions, and p-values.
colora (matplotlib color) – Points color of the first group.
colorb (matplotlib color) – Points color of the second group.
pts_kws (dict, optional) – Keyword arguments forwarded to the matplotlib function used for plotting the points.
ax (matplotlib Axes, optional) – The target handle for this figure. If
None, the current axes is set.
Example
(Source code, png)